OPINION ON TODAY
This is bad...mkt will weaken throughout the day:
1) Upward revisions mean slowdown is worse than feared
2) Upward revisision and headline number and rate means QE NOT likely
3) All the change to get to 8.1 was a decrease in particpation rate
4) Hourly earnings weak
and Europe likely to fade into the close on election fears
http://seekingalpha.com/currents/post/297321
ALSO
One does not need to be a rocket scientist to grasp the fudging the BLS has been doing every month for years now in order to bring the unemployment rate lower: the BLS constantly lowers the labor force participation rate as more and more people "drop out" of the labor force for one reason or another. While there is some floating speculation that this is due to early retirement, this is completely counterfactual when one also considers the overall rise in the general civilian non institutional population.
Labor Force Statistics from the Current Population Survey
| Year | Jan | Feb | Mar | Apr | May | Jun | Jul | Aug | Sep | Oct | Nov | Dec | Annual |
|---|---|---|---|---|---|---|---|---|---|---|---|---|---|
| 2002 | 66.5 | 66.8 | 66.6 | 66.7 | 66.7 | 66.6 | 66.5 | 66.6 | 66.7 | 66.6 | 66.4 | 66.3 | |
| 2003 | 66.4 | 66.4 | 66.3 | 66.4 | 66.4 | 66.5 | 66.2 | 66.1 | 66.1 | 66.1 | 66.1 | 65.9 | |
| 2004 | 66.1 | 66.0 | 66.0 | 65.9 | 66.0 | 66.1 | 66.1 | 66.0 | 65.8 | 65.9 | 66.0 | 65.9 | |
| 2005 | 65.8 | 65.9 | 65.9 | 66.1 | 66.1 | 66.1 | 66.1 | 66.2 | 66.1 | 66.1 | 66.0 | 66.0 | |
| 2006 | 66.0 | 66.1 | 66.2 | 66.1 | 66.1 | 66.2 | 66.1 | 66.2 | 66.1 | 66.2 | 66.3 | 66.4 | |
| 2007 | 66.4 | 66.3 | 66.2 | 65.9 | 66.0 | 66.0 | 66.0 | 65.8 | 66.0 | 65.8 | 66.0 | 66.0 | |
| 2008 | 66.2 | 66.0 | 66.1 | 65.9 | 66.1 | 66.1 | 66.1 | 66.1 | 65.9 | 66.0 | 65.8 | 65.8 | |
| 2009 | 65.7 | 65.8 | 65.6 | 65.6 | 65.7 | 65.7 | 65.5 | 65.4 | 65.1 | 65.0 | 65.0 | 64.6 | |
| 2010 | 64.8 | 64.9 | 64.9 | 65.1 | 64.9 | 64.6 | 64.6 | 64.7 | 64.6 | 64.4 | 64.5 | 64.3 | |
| 2011 | 64.2 | 64.2 | 64.2 | 64.2 | 64.2 | 64.1 | 64.0 | 64.1 | 64.1 | 64.1 | 64.0 | 64.0 | |
| 2012 | 63.7 | 63.9 | 63.8 | 63.6 |

---------------------------------------------------------------------------------------------
If you want a true gauge of the sustainability of the economic recovery, look no further than employment and housing. If the job and housing markets remain weak, the consumer-driven U.S. economy will continue to sputter.
It's that simple.
On the jobs front, private employment increased by 119,000 in April, the smallest gain in seven months, after rising by 201,000 in March (according to a report published by ADP on Wednesday).
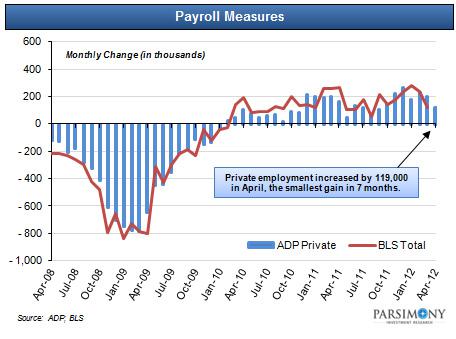
As shown in the chart above, the ADP report has a strong historical correlation (0.95) with BLS estimates of total nonfarm payroll employment. As such, many analysts now think that Friday's jobs report will come in well below consensus estimates (167,000).
Even if actual payrolls come in close to consensus estimates, monthly employment growth continues to hover below the magic 200,000 number that signals a strong job market. Payroll growth below this level has historically been negative for stocks.

Employment and Stocks
After troughing in mid-2009, monthly payroll growth turned positive again in early 2010 and the job market appeared to be stabilizing (see chart above). The equity market also began to strengthen, rallying significantly throughout 2010 and early 2011.
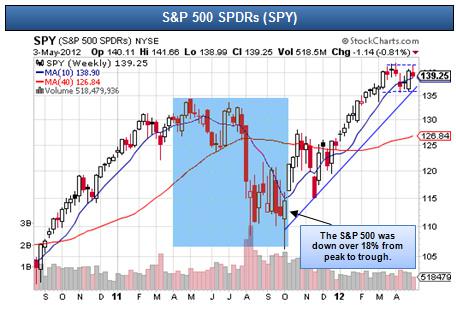
Payroll growth dropped below 200,000 in May 2011 and stayed below that level for seven consecutive months (through October 2011). As shown in the chart above, the S&P 500 (SPY) was down over 18% from peak to trough over that period.
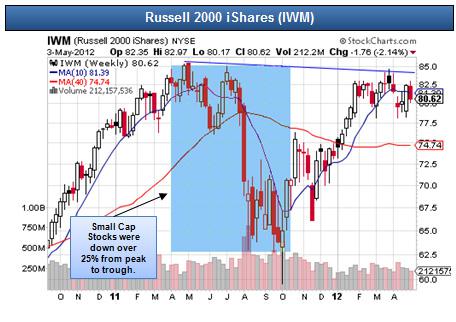
The Russell 2000 (IWM) fared even worse, declining over 25% over that period (see chart below).
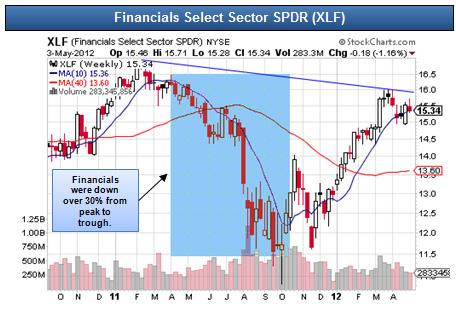
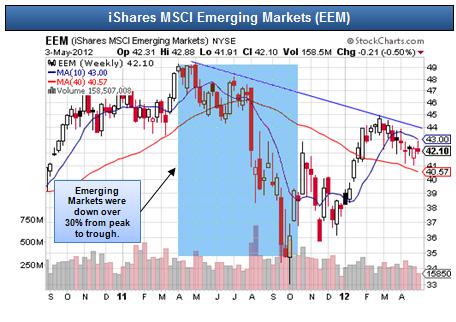
Other high beta sectors like Financials (XLF) and Emerging Markets (EEM) were down over 30% during this sustained period of slow payroll growth (see charts below).
If the recent payroll report is the start of a new trend of stagnant employment growth, equities could be in trouble in the coming months.
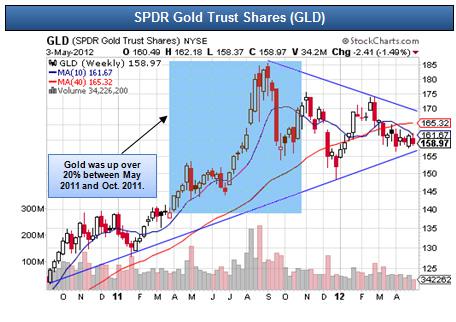
Investors should continue to monitor the employment market very closely and consider hedging their equity positions and/or diversifying into asset classes that will perform better in a "risk off" environment (like precious metals).
As shown in the chart below, gold (GLD) was up over 20% from May 2011 to October 2011.
todays news
U.S. employers decreased hiring for the second straight month in April but the unemployment rate still fell to 8.1 percent, giving mixed messages about the economy's strength ahead of President Barack Obama's November re-election bid.
Employers added 115,000 workers to their payrolls last month, the Labour Department said on Friday.
The reading keeps fears alive that the U.S. economy is losing momentum and dampens hopes that a stretch of strong winter hiring signaled a turning point for the recovery.
The unemployment rate ticked a tenth of a point lower to a three-year low, as people left the work force. The jobless rate is derived from a separate survey of households, which showed a drop in the number of jobs in April.
Still, the government revised upward its initial estimates for payroll growth in February and March by a combined 53,000. That left the six-month average of job growth at 197,000, nearly exactly where it would have been had April job growth come in as expected at 170,000.
"We're still growing just gradually," said Nigel Gault, an economist at IHS Global Insight in Lexington, Massachusetts.
"Hiring is coming back into line with what you would expect with sluggish growth."
The report, which regularly sets the tone for financial markets around the world, could rattle nerves at the White House. Weak U.S. growth and high unemployment create a formidable headwind for Obama, who entered office during the darkest days of the 2007-09 recession.
His Republican challenger, Mitt Romney, repeatedly has accused Obama of doing too little to foster job growth.
The unemployment rate, which soared to as high as 10 percent during Obama's first year in the office, held near 9 percent for most of last year before falling sharply over the winter.
Still, it remains about 2 percentage points higher than its average over the last 50 years, and the U .S. Federal Reserve thinks it probably will not post a full recovery for at least another several years.
Nevertheless, Fed Chairman Ben Bernanke said last month the central bank is providing enough support for the economy.
WEATHER REPORTS
So far this year, the labour market has given mixed signals.
During the winter, fast growth in payrolls led many analysts to think the economy was turning a corner. Then jobs growth braked in March, fueling fears the recovery was losing momentum.
Most economists think mild weather muddied the waters, boosting hiring in the winter but making spring look weaker because companies had pulled hiring forward.
"It's not that there's something wrong with the economy. Employment just got ahead of itself," said Robert Mellman, an economist at JPMorgan in New York.
The report showed the private sector accounted for all the job gains in April, adding 130,000 new positions. Manufacturing registering another strong month, adding 16,000.
Wall Street analysts see economic growth holding at a lackluster 2.2 percent annual rate in the second quarter, matching its pace in the first three months of the year.
The length of the average work week held steady at 34.5 hours in April.